Did you know that there is a way to guarantee that every picture you take is perfectly exposed?
A lot of photographers snap a photo, check it out on the back of their camera, and move on if it looks good.
However, you can’t always trust what you see on the screen and it’s definitely not the best way to check for proper exposure.
Why? Because what you see on the back of your camera’s glowing screen could be affected by the display’s brightness settings and ambient light.
For example, a photo might look nice and bright on the back of your camera and then when you get it on your computer you realize it’s completely underexposed (too dark).
Here’s your secret weapon for making sure you always have the right exposure…
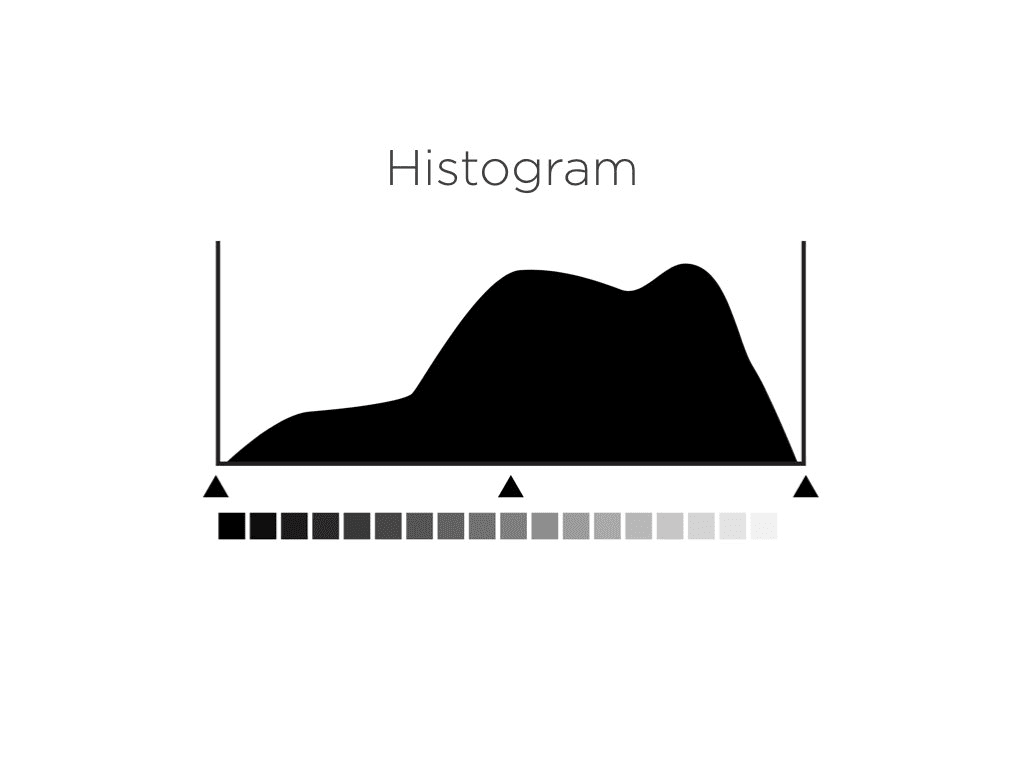
It’s called a histogram. You can think of this as a simple bar chart that shows how many dark, medium, and light-toned pixels you have in your photo. Dark tones are on the left, medium tones in the middle, and light tones on the right.
Learning to read a histogram will open up one of the most important tools you can use as a photographer.
Most cameras allow you to pull up a histogram when reviewing an image on the back of your camera. (You may need to dive into your playback settings to enable this feature.)
Also, most cameras can show a histogram when photographing in Live View Mode. Mirrorless cameras have a live histogram feature as well. This means that on many cameras you can see a histogram as you are taking a picture. This is super helpful!
Histograms can seem confusing at first, but don’t be intimidated. Let’s look at a couple of examples to get the hang of it.
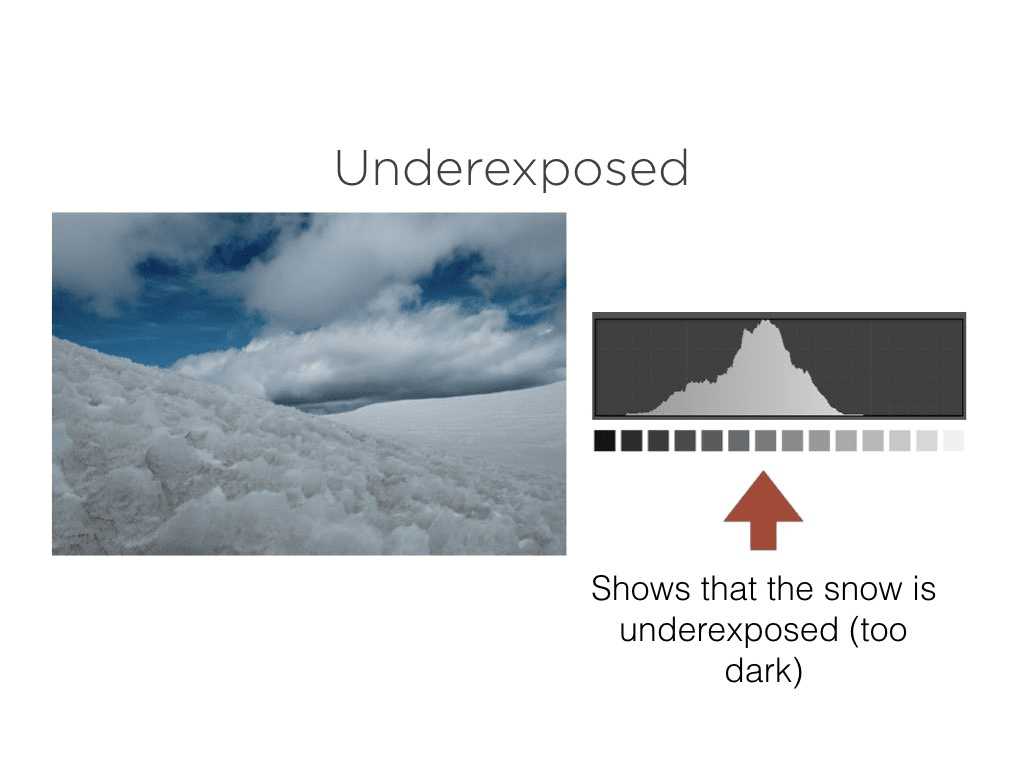
Let’s say you were photographing this snowy scene shown above. You pull up the histogram and see that the graph is showing a lot of medium toned pixels. This would be the clue that your image is underexposed (too dark).
Logically, you know that white show and clouds should register as lighter pixels on the histogram, so this means you need to let more light into your camera by adjusting one of your exposure settings or using exposure compensation.
Here’s the correct histogram for this scene:
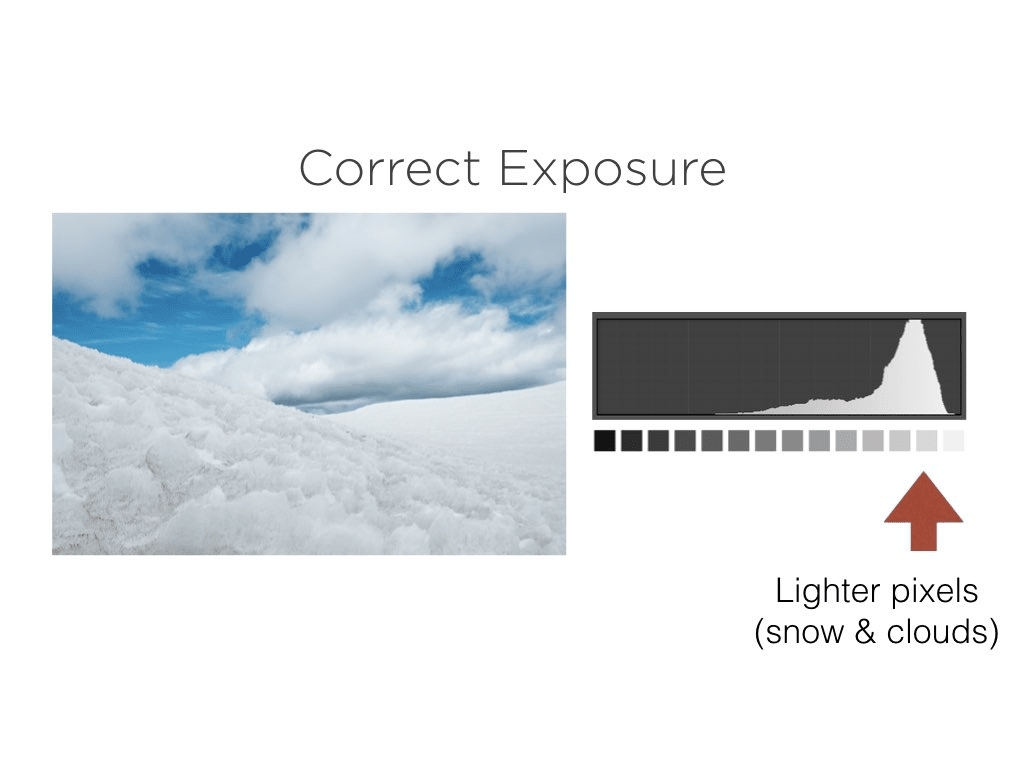
As you can see, now the histogram indicates a lot of light pixels, which is what you expect in a scene like this.
Now, let’s pretend that when you were adjusting your camera settings you went a little too far and let in too much light.
Here is what the histogram would look like in this case:
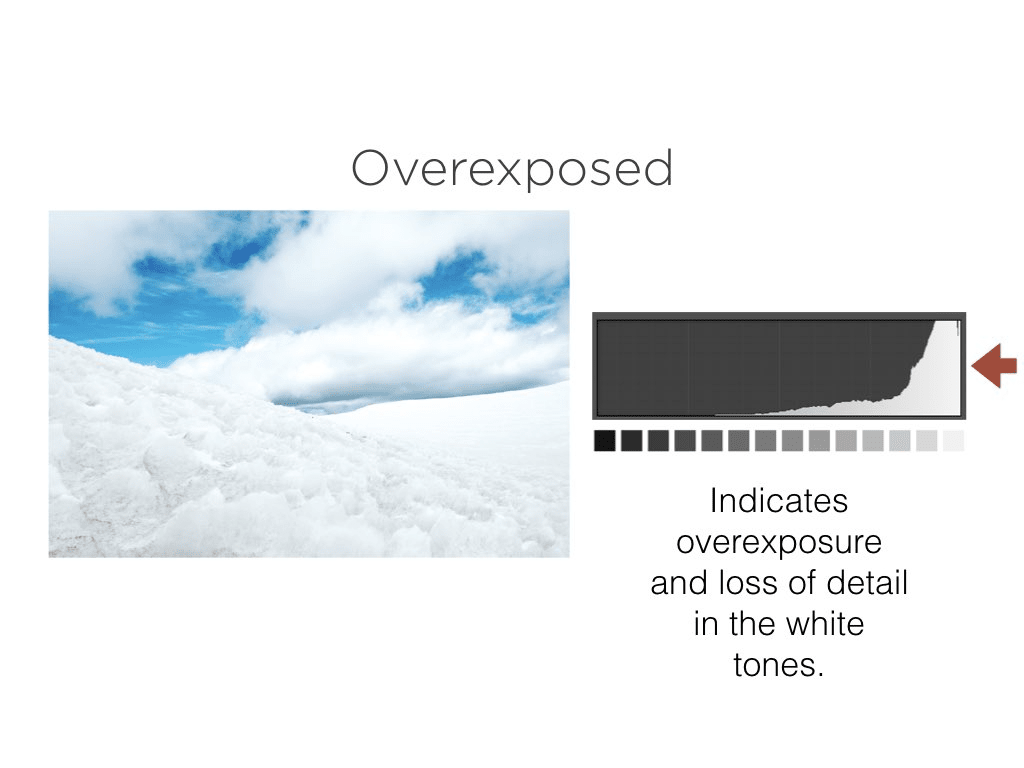
Notice in the example above that the histogram has so many light pixels that it’s bumping up against the right hand side of the graph? This indicates that the image is overexposed and lacking detail in the brightest areas. In this instance you would need to adjust your camera settings to slightly darken the image.
Let’s look at one last example:
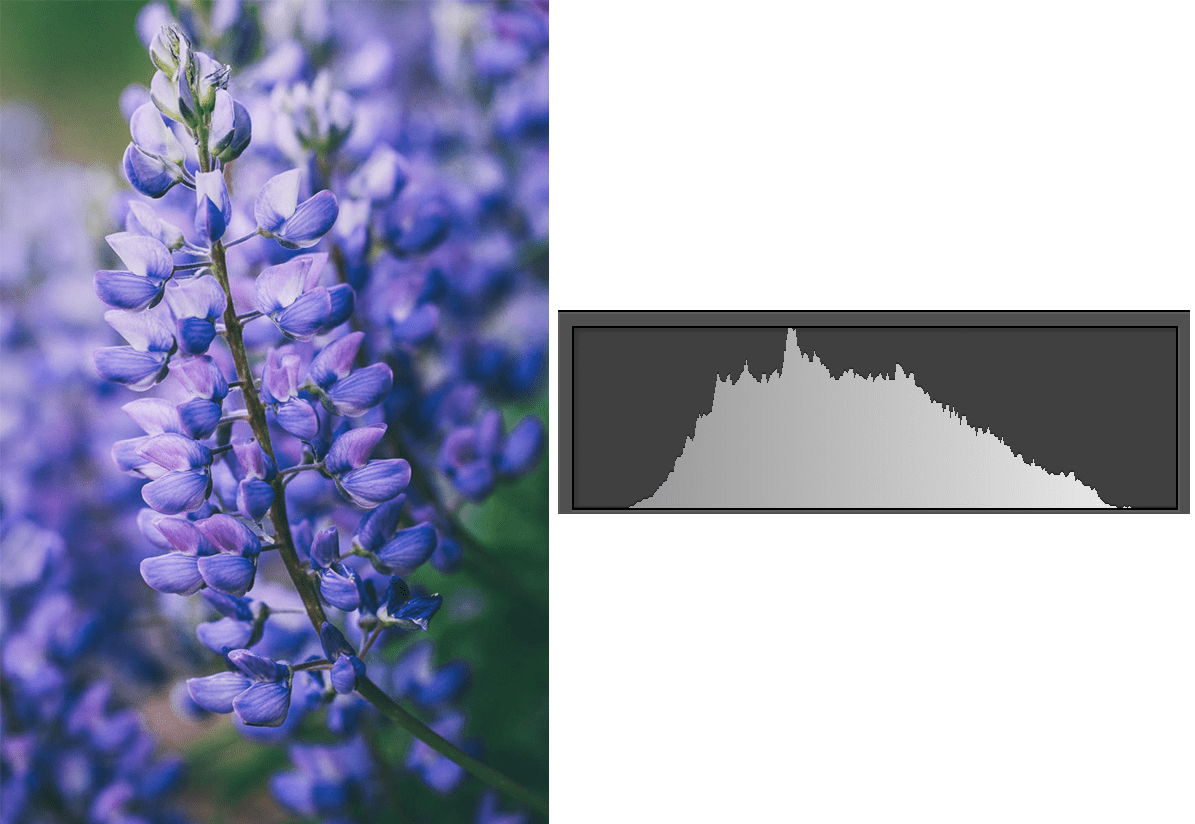
This flower photo is mostly made up of midtones. There is nothing super bright or dark in the image. Therefore, the histogram above, showing mostly midtones, tells us that the image is perfectly exposed for the subject.
I hope this helps you see the power of learning to read a histogram. Once you know this trick, you’ll never have to worry about coming home with poorly exposed images again!
— Daniel